Client Project/AEC / BIM Software
BIM IoT Smart Building Dashboard Case Study
BIM IoT is a smart building dashboard that connects BIM models with live and historical IoT sensor data.
Remote delivery
3D Viewer & BIM Software Development, SaaS Platform Development, Custom Software Development
About the Project
BIM IoT is a smart building dashboard that connects BIM models with live and historical IoT sensor data. The application lets users view Autodesk models in the browser, inspect building floors, visualize sensor readings as heatmaps and sprites, and monitor context such as weather, time, and last refresh status. The product combines model visualization, sensor mapping, live data refresh, historical timelines, and building context panels to help users understand physical spaces through BIM-linked operational data.
Building Smart Building Dashboard with practical implementation discipline
BIM IoT is a smart building dashboard that connects BIM models with live and historical IoT sensor data. The application lets users view Autodesk models in the browser, inspect building floors, visualize sensor readings as heatmaps and sprites, and monitor context such as weather, time, and last refresh status. The product combines model visualization, sensor mapping, live data refresh, historical timelines, and building context panels to help users understand physical spaces through BIM-linked operational data.
Why this Smart Building Dashboard matters for the industry
For smart building, facilities, and BIM operations teams, the hard part is not just launching software. The harder problem is that building operators need to connect model context with live sensor readings instead of reviewing IoT data outside the space it describes. This case study shows how a focused implementation can turn that friction into a smart building dashboard that connects BIM models with live and historical IoT visualization.
Clarifies the operating workflow behind BIM IoT dashboard instead of only presenting a user interface.
Connects the product experience to real business actions such as onboarding, discovery, reporting, support, payments, content, or admin control.
Gives similar teams a practical reference for what to centralize, what to automate, and what should remain easy for humans to manage.
Helps buyers and operators understand the practical implementation choices behind the workflow, not just the finished interface.
Before and After the Build
Before
Sensor readings were hard to interpret without spatial model context.
Facilities teams needed browser-based access to floors, heatmaps, sprites, and sensor overlays.
Historical and live building data needed a shared visualization layer.
After
The dashboard connects Autodesk models with live and historical IoT sensor data.
Users can inspect floors and visualize readings directly on the building model.
The system gives facilities teams a practical bridge between BIM context and operational telemetry.
Challenges We Faced
1. Product and workflow clarity
Turning the smart building dashboard concept into a usable, structured product experience.
2. Technical implementation depth
Coordinating the implementation across React, Next.js, TypeScript, Autodesk Platform Services, and related platform services.
Key Features Delivered
Autodesk BIM model viewer
BIM model list and URN switching
Autodesk model translation status
IoT sensor mapping
Sensor sprites, labels, and tooltips
Live sensor data refresh
Historical sensor timeline
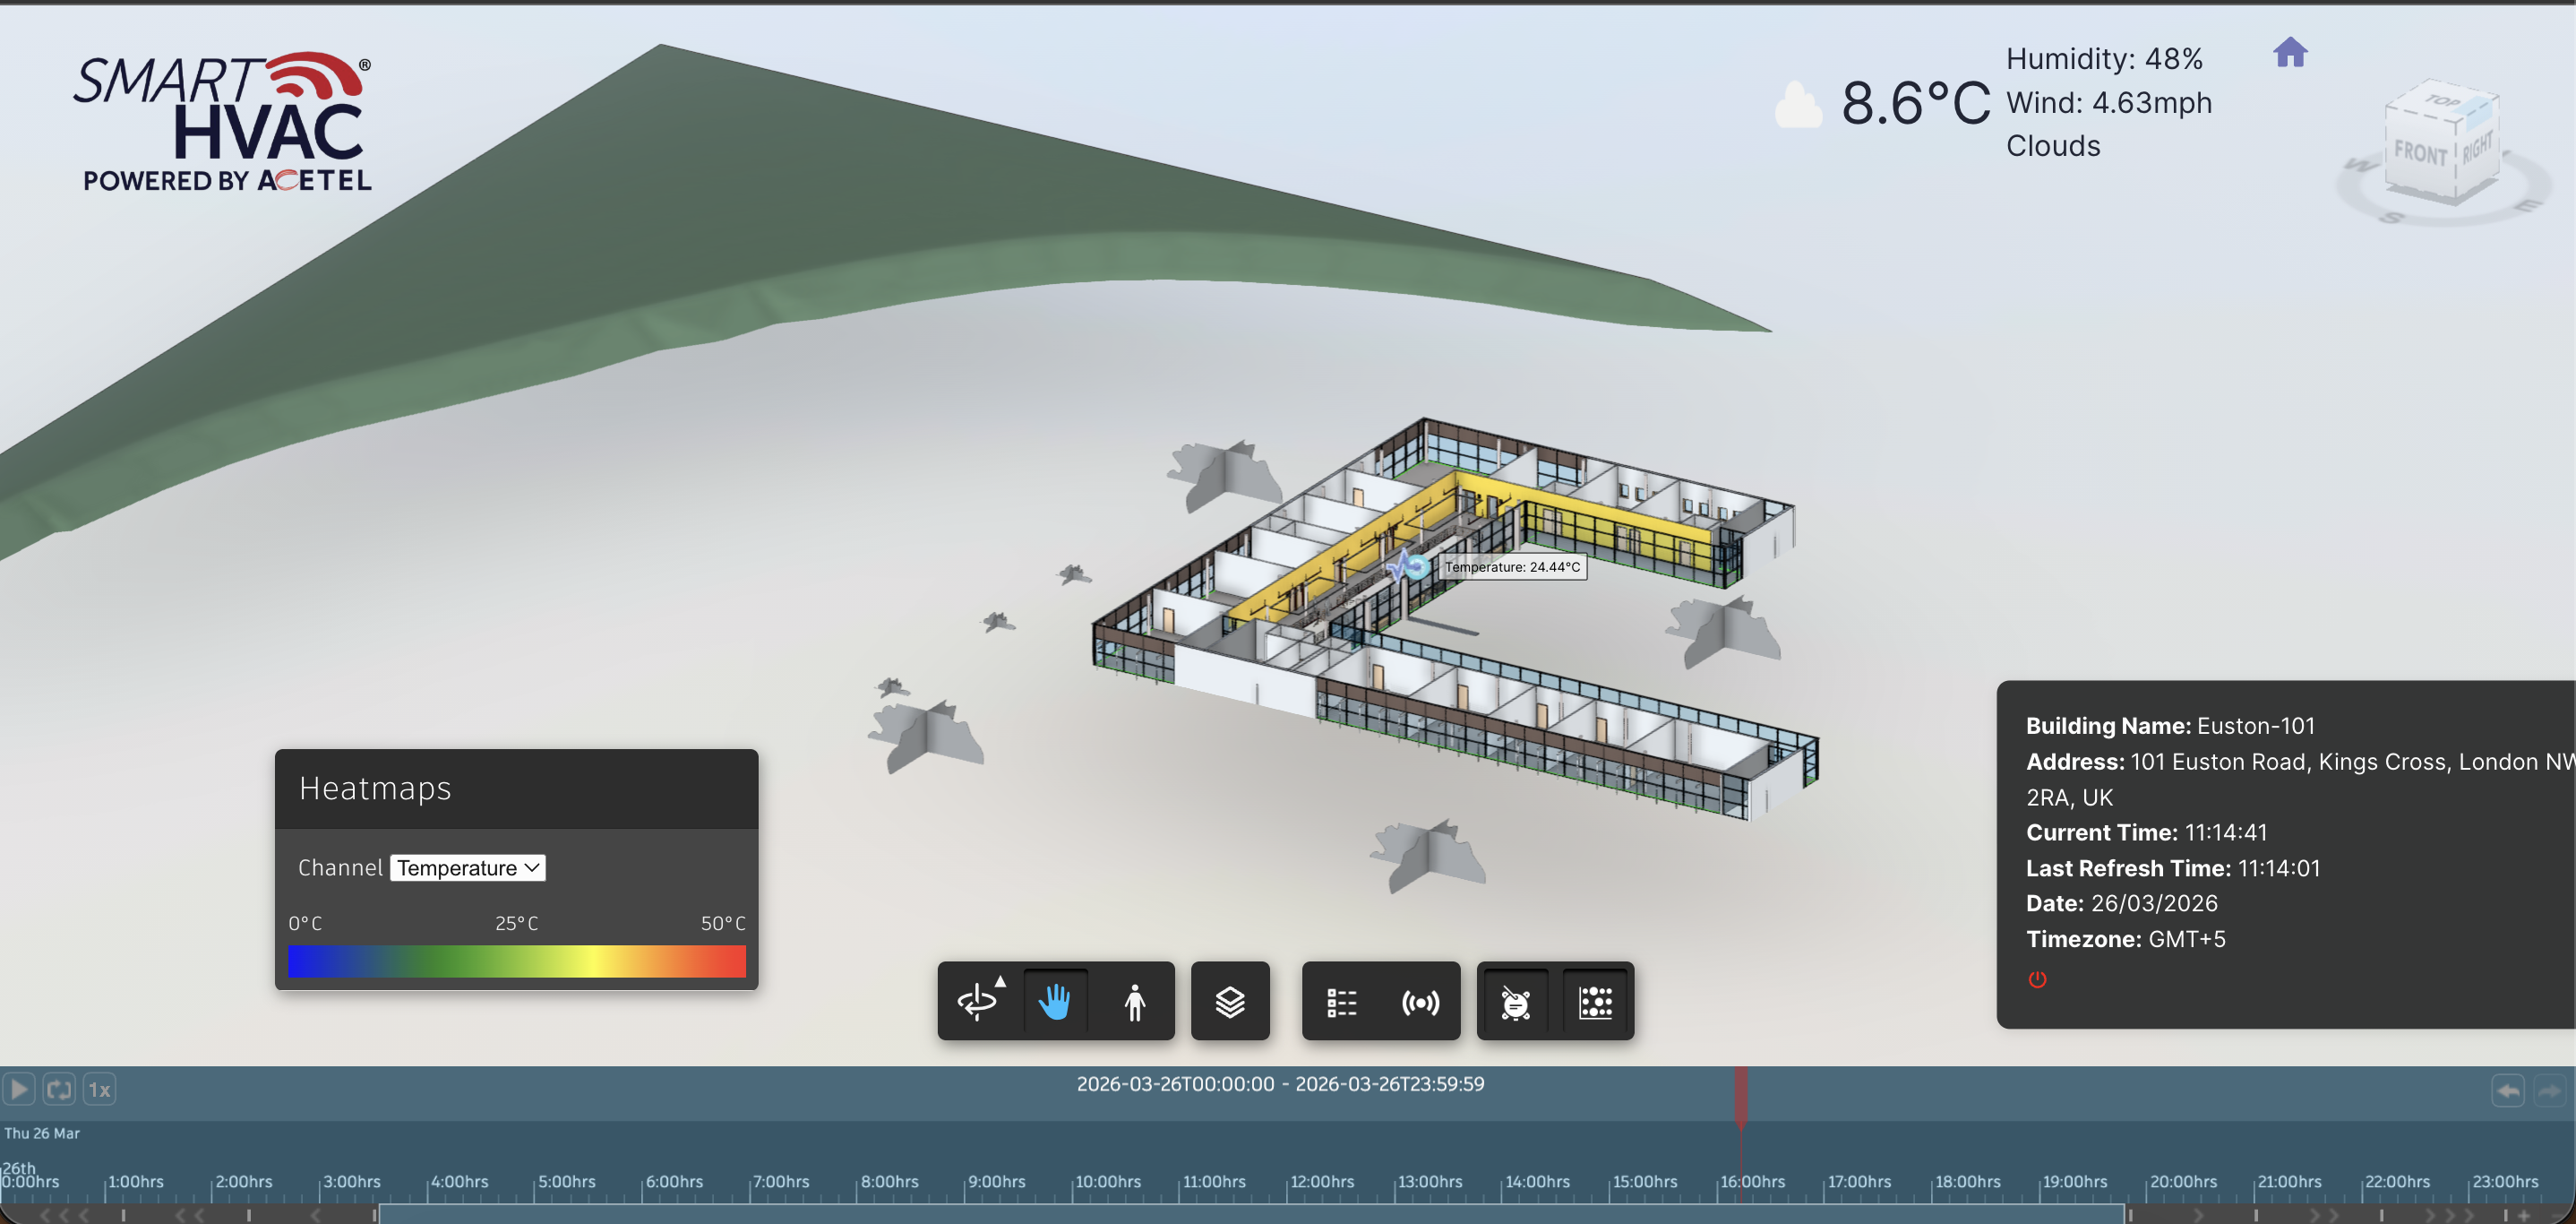
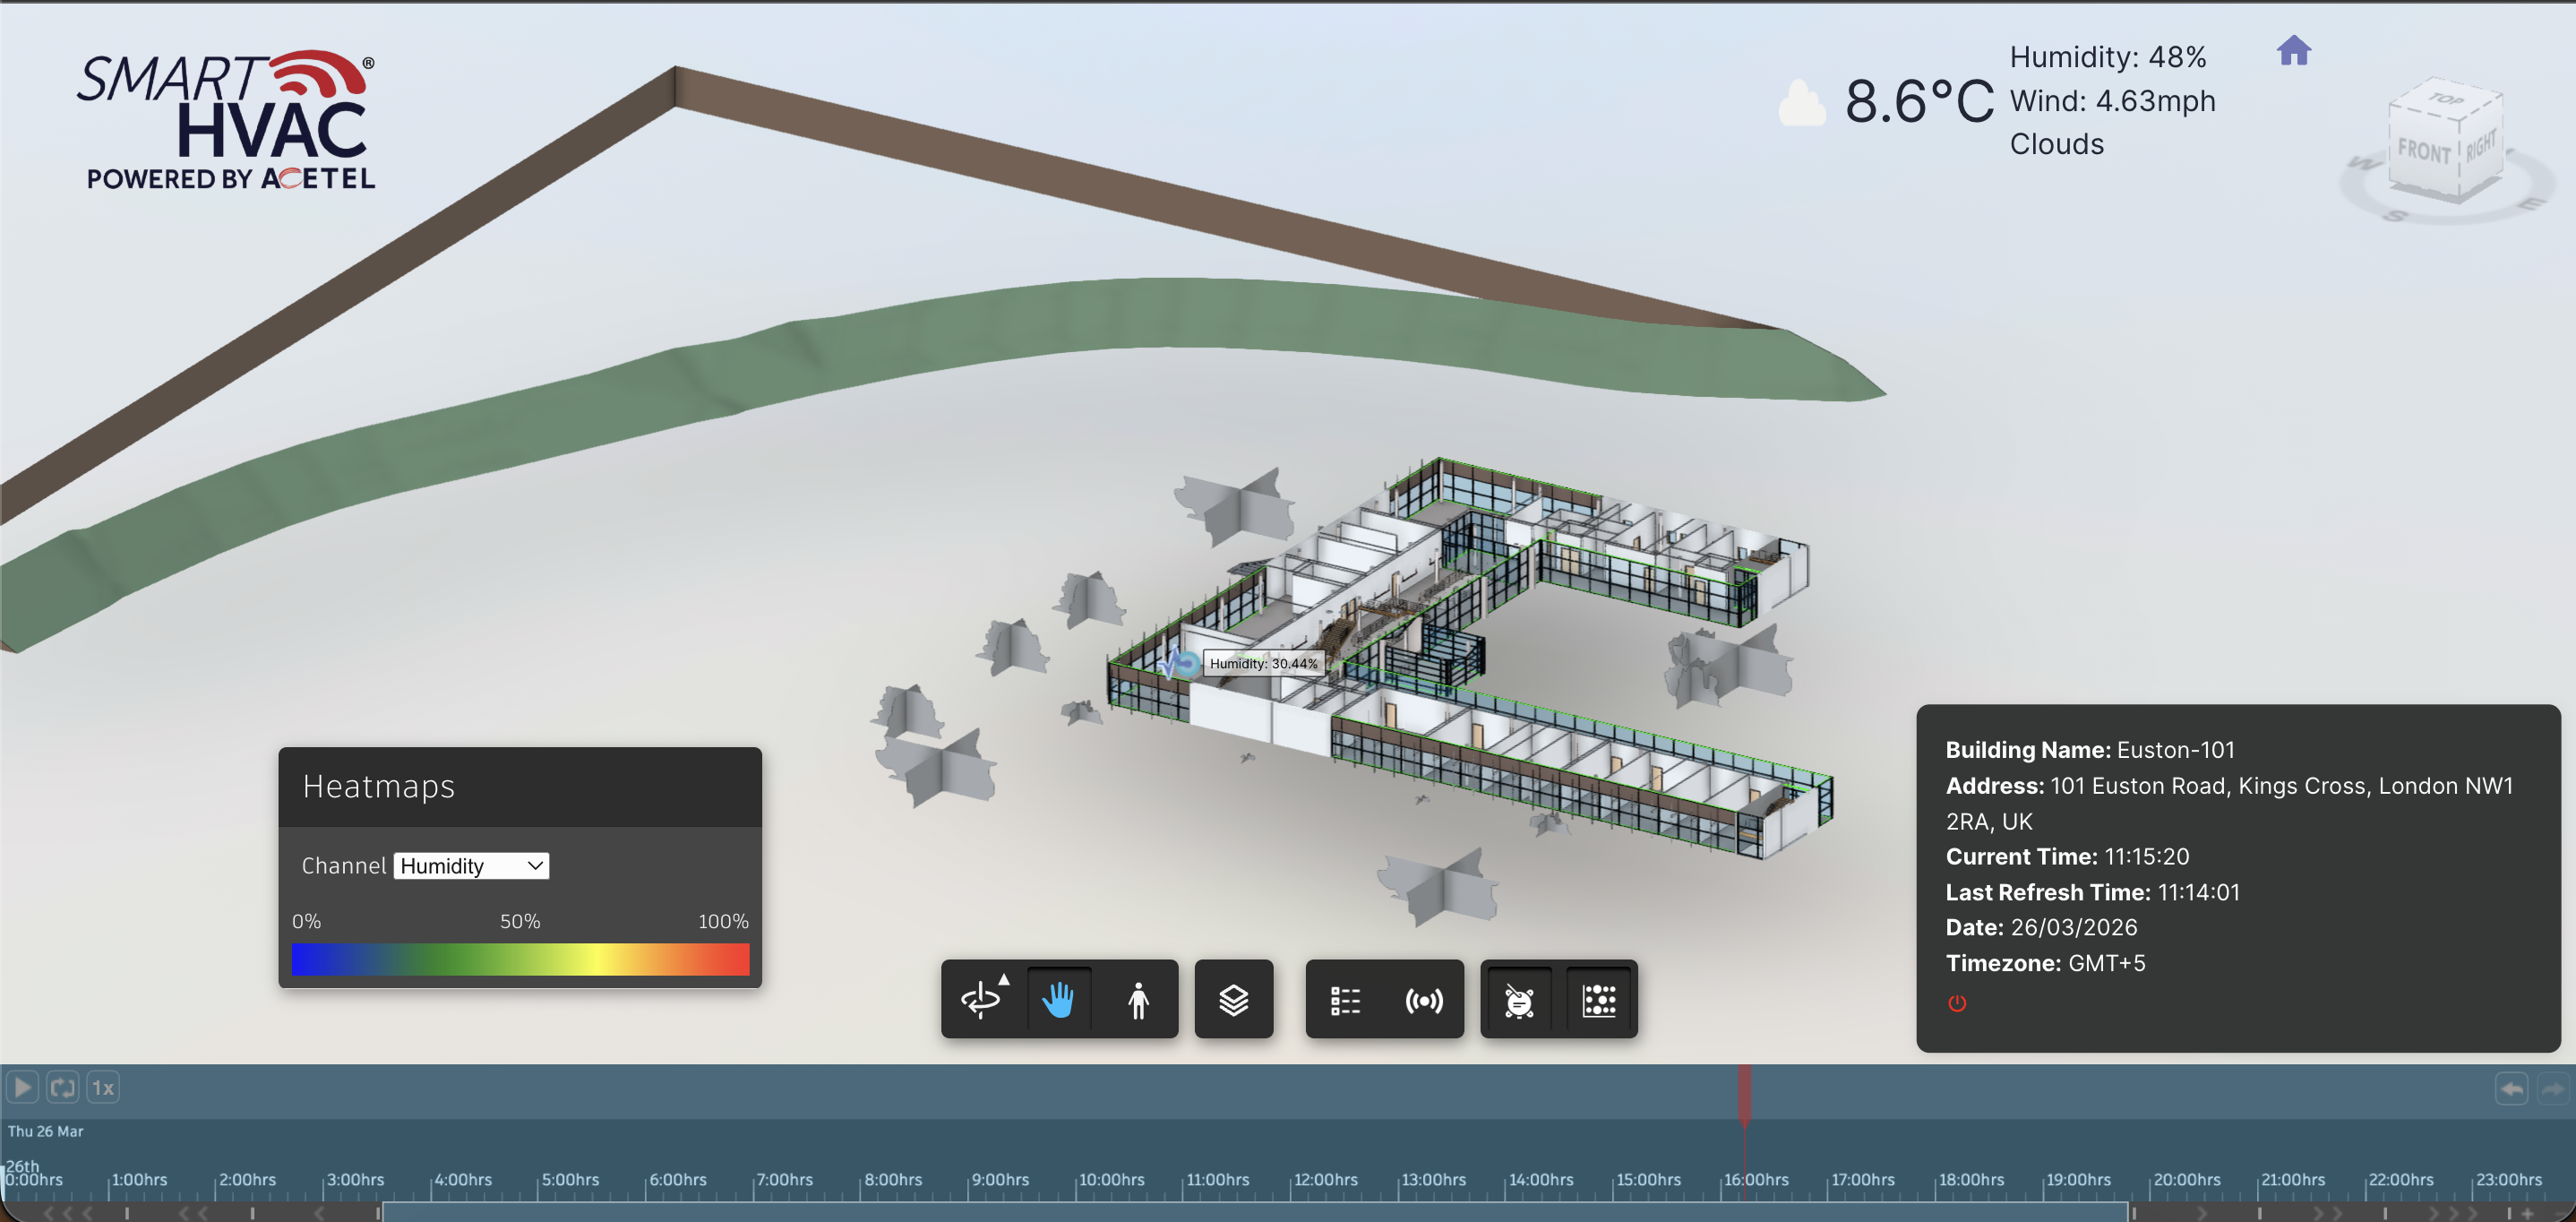
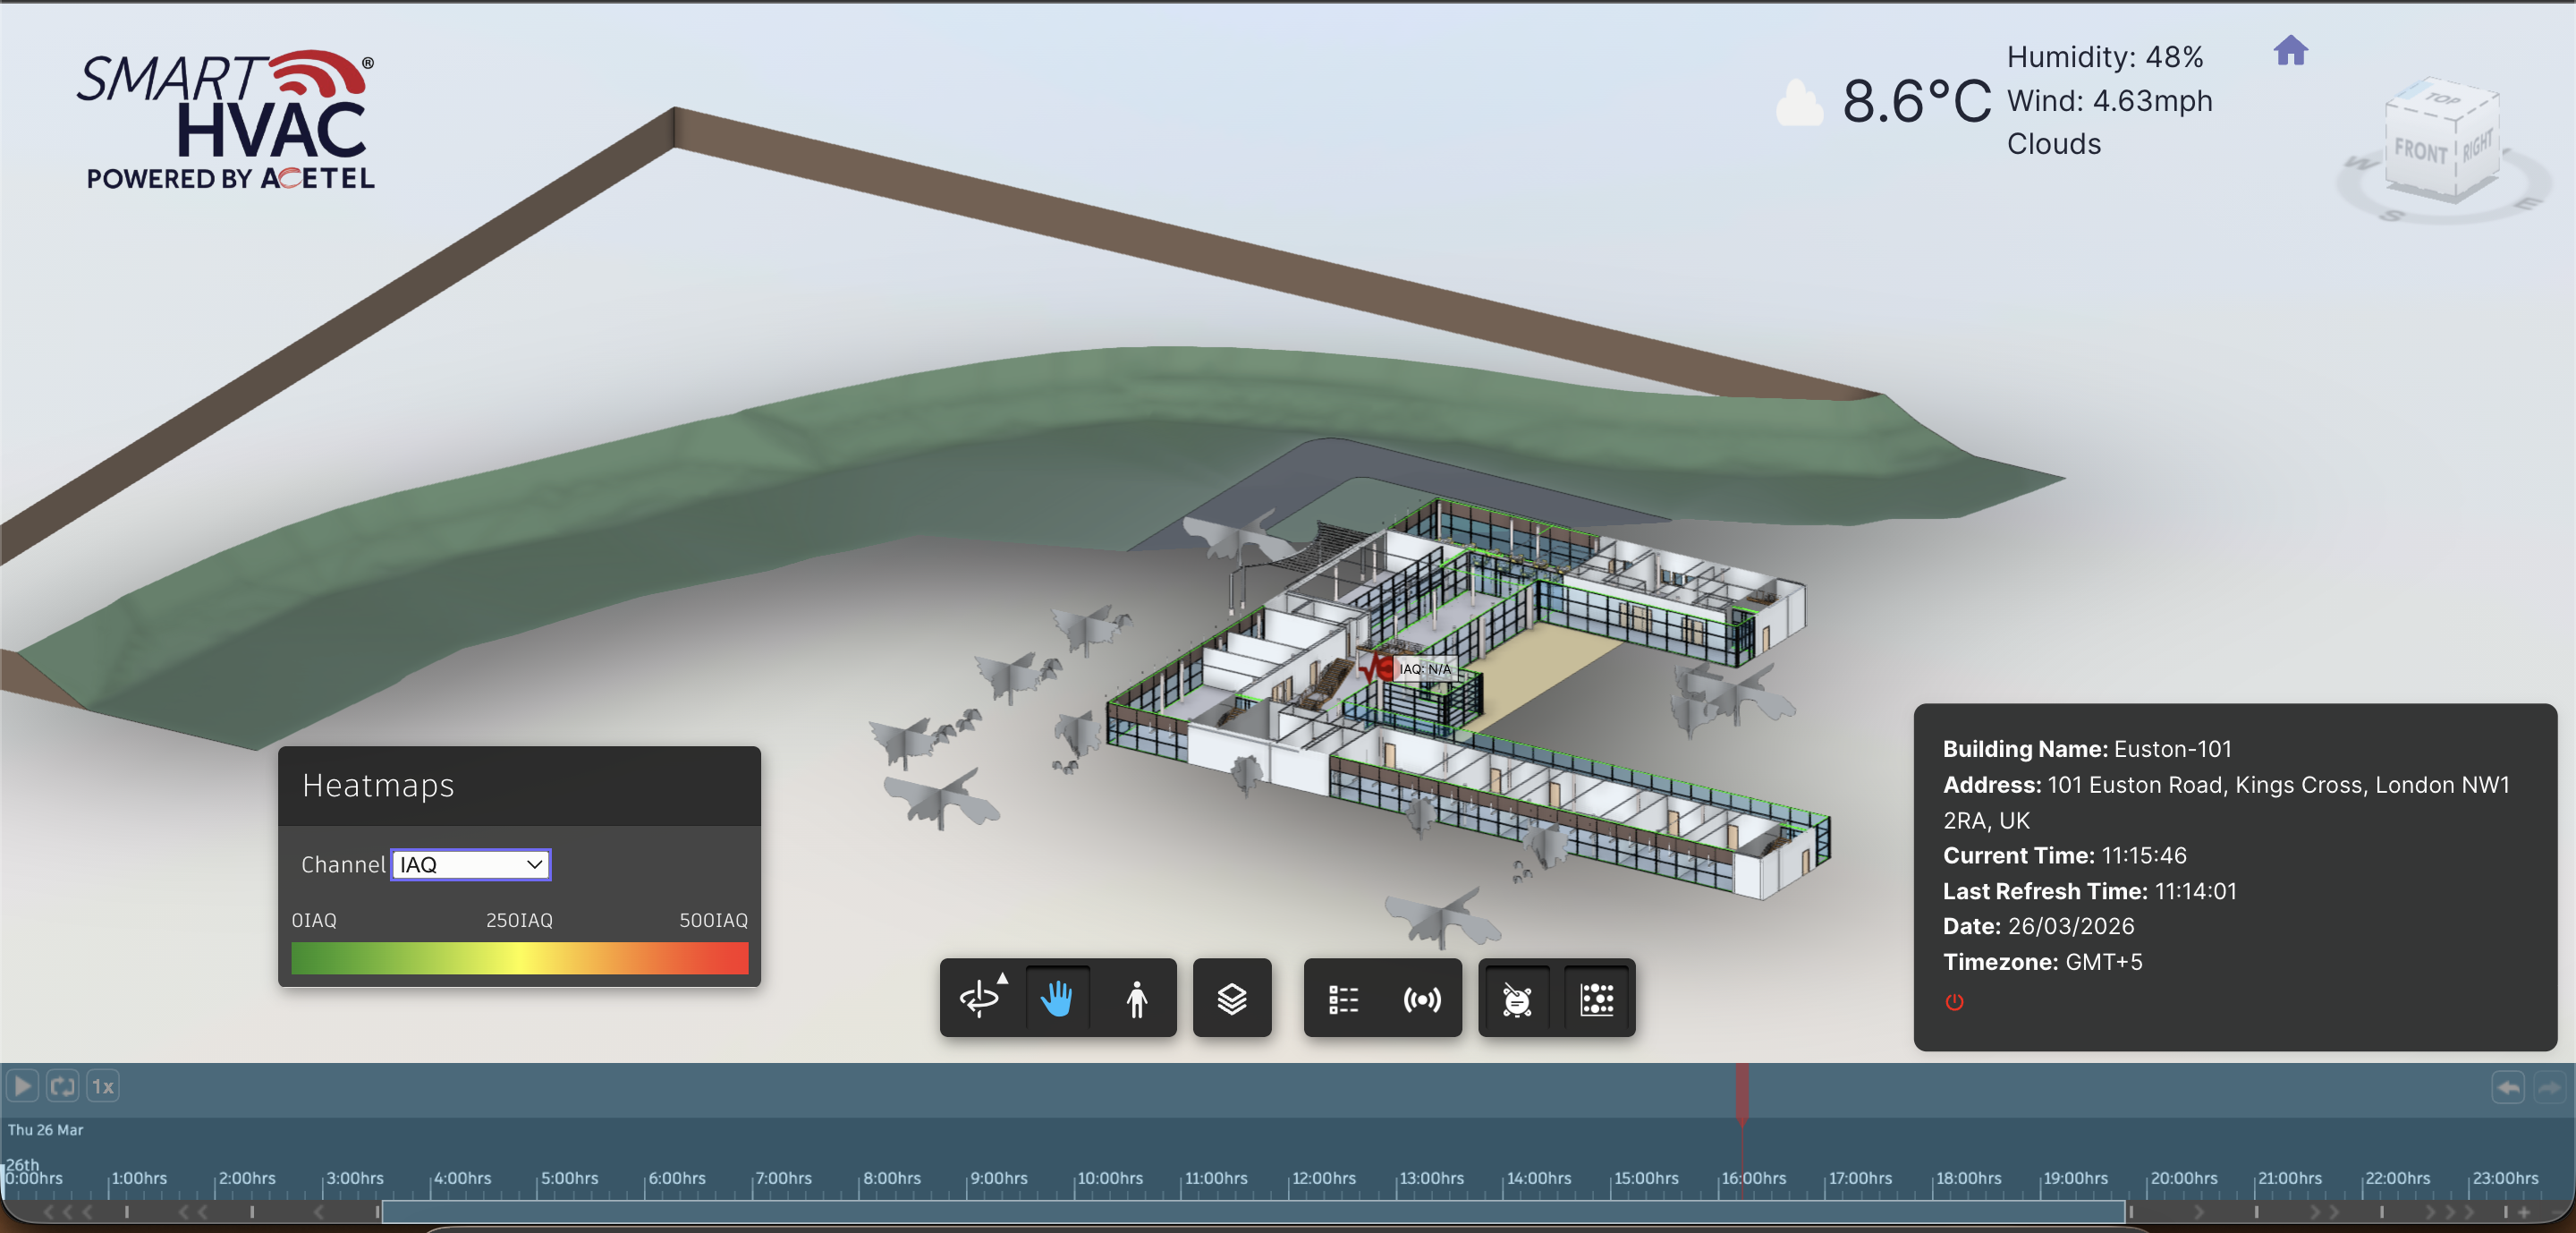
Heatmap visualization
Temperature, humidity, CO2, and IAQ channels
Floor and level selection
Model summary panel
Offline sensor indicators
Weather and local time widgets
InfluxDB sensor data queries
Authentication guard
How We Solved It
UI/UX implementation.
Frontend and backend API development.
Autodesk Platform Services integration.
Custom viewer extension development.
IoT data visualization.
InfluxDB integration.
Sensor data API development.
Heatmap and sprite extensions.
Implementation Scope
UI/UX implementationFrontend and backend API developmentAutodesk Platform Services integrationCustom viewer extension developmentIoT data visualizationInfluxDB integrationSensor data API developmentHeatmap and sprite extensionsTimeline playbackRedux state managementWeather API integrationResponsive dashboard and deployment
How the System Was Structured
Experience layer
React, Next.js, TypeScript, Redux Toolkit shaped the user-facing product screens, responsive flows, and role-specific interface patterns.
Workflow and data layer
The workflow and data layer organized the records, permissions, and business logic required for the platform to operate.
Integration layer
Autodesk Platform Services, Autodesk Viewer, Autodesk Data Visualization connected the product to the external systems, AI services, media storage, analytics, and deployment surfaces it needed.
Operating layer
Admin screens, structured content, dashboards, and repeatable workflows made the system easier to maintain after launch instead of leaving value trapped in custom code.
Project Screenshots
Results Delivered
Delivered a smart building dashboard project with implementation coverage across Autodesk BIM model viewer, BIM model list and URN switching, Autodesk model translation status, IoT sensor mapping.
3D Viewer & BIM Software Development
SaaS Platform Development
Custom Software Development
Operational lift for smart building, facilities, and BIM operations teams
The value of this case study is in the operating shift: a smart building dashboard that connects BIM models with live and historical IoT visualization. For teams in this category, that means clearer ownership, fewer scattered tools, and a stronger foundation for growth.
Reduces scattered work by moving the core BIM IoT dashboard workflow into a structured product surface.
Improves visibility because users, admins, or operators can inspect the state of the workflow instead of relying on informal updates.
Creates a stronger foundation for future automation, analytics, integrations, and workflow expansion.
Autodesk BIM model viewer gives teams a more repeatable way to handle autodesk bim model viewer without rebuilding the workflow manually.
What smart building, facilities, and BIM operations teams can take from this Smart Building Dashboard build
BIM IoT is useful beyond the project itself because it shows how a focused product can reduce operating friction in a specific workflow category.
Start with the workflow that creates repeated manual drag, then design the product around making that workflow visible and easier to complete.
Use integrations only where they remove a real handoff. A connected stack is valuable when it improves data flow, support quality, reporting, or user speed.
Keep admin control and content maintenance in the architecture from the start so the product does not become fragile after launch.
Treat AI, automation, and dashboards as operating layers. They should help teams make decisions, complete work, or understand exceptions rather than exist as disconnected features.
Technologies We Used
Questions This Case Study Helps Answer
What problem does this smart building dashboard solve?
BIM IoT addresses a common problem for smart building, facilities, and BIM operations teams: building operators need to connect model context with live sensor readings instead of reviewing IoT data outside the space it describes. The build turns that issue into a smart building dashboard that connects BIM models with live and historical IoT visualization.
What can similar teams learn from the BIM IoT build?
The main lesson is to design around the operating workflow first. Screens, integrations, data models, and AI features become more useful when they reduce handoffs and make the work easier to inspect.
What technology stack supported this case study?
The implementation used React, Next.js, TypeScript, Autodesk Platform Services, Autodesk Viewer, Forge APIs, InfluxDB, Three.js, and related platform services to support the product experience, workflow logic, and integrations.
When should a company build a custom smart building dashboard?
A custom build makes sense when off-the-shelf tools cannot match the workflow, data model, integrations, or user experience required by the business. The goal is not custom software for its own sake; it is operational leverage that holds up after launch.
Ready to Start?
Let's Build Something Great Together
Have a project in mind? Let's discuss how we can help bring your vision to life with our expertise in React, Next.js, and more.